There are a number of useful models for visualizing and interacting with systems. This is part of the second stage of the information process with Social Innovation Labs. Once a group has an understanding of the current state, how can information visualization help participants understand the relationships between elements of the system, play with alternatives and test assumptions about actions that can shift the state of a system.
Basins of Attraction
A useful framework for analyzing the current system state is the concept of basins of attraction. As defined by Walker1 et al., “a ‘basin of attraction’ is a region in state space in which the system tends to remain (2004). For systems that tend toward an equilibrium, the equilibrium state is defined as an ‘attractor’…” In social innovation terms, a basin of attraction would represent the current state of a system regime. Westley et al. define a regime as “the dominant rule-sets supported by incumbent social networks and organizations and embedded in dominant artefacts and prevailing infrastructures, of say, particular industries or social problem arenas.” (2011). The following figure shows a graphical illustration of the model, in this case showing relationships between multiple variables and regimes in a three-dimensional view. In this three-dimensional framework the map is comparable to the effect of gravitational fields Einsteinian space (Walker, et al., 2004). Different basins exert force that can attract the system. This is critical when looking at how to move to a different, desired, system state. It may be difficult to get from “here to there” without dropping into an unwanted state due to its attractiveness and resilience.
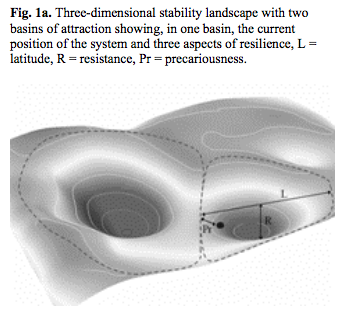
Figure 2: Three-dimensional basin of Attraction Visualization. (Walker et al. 2004)
Moving from one basin to the next
The challenge for social or institutional entrepreneurs is how to take action that will shift the current system into a different basin of attraction. It is important to note that change is automatic as shown by thinkers as diverse as Karl Marx and Joseph Schumpeter (Cited by S. Quilley, personal communication, November 23, 2012) Systems will crash and change – the question is the degree to which human beings can become conscious collectively and guide the change (S. Quilley, personal communication, November 23, 2012). In Westley’s words, “Where is the change you want to see?” (Personal communication, November 27, 2012). In effect this is asking the question of whether to work towards increasing or to reducing resilience? Increasing resilience equates to lowering the new basin – making the new system more attractive, more stable, more likely to “stick” given a system shock. Alternatively, one might take the approach of reducing the resilience of the current system – effectively raising the level of the old basin. The illustration below provides a graphical representation of these two alternatives. Note that the alternatives are not mutually exclusive. For the successful translation of niche innovations to regime change (Smith 2007), a patchwork or bricolage (Gundry et al. 2011), of innovations are needed.
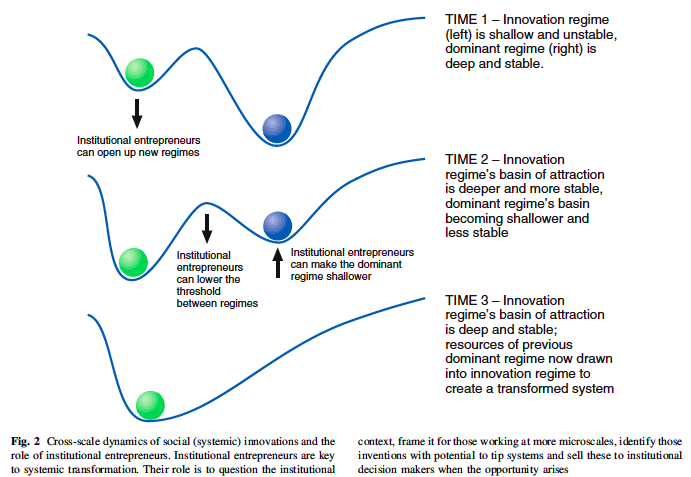
Figure 3: Illustrating Regime Change with Basins of Attraction Model. (Westley et al. 2011)
From a visualization standpoint, the basins of attraction model is very useful for gaining a common understanding of the current system state, alternative states and landscape variables that may impact regime translation. However, as a visual model, it is missing crucial detail. It It does not adequately show the factors that both define the current system, and map the current landscape. It similarly does not exhibit the variables that might need to be affected in order to change the current state. For that we must turn to system mapping.
Complex adaptive systems Maps
Mapping complex adaptive systems visually is a powerful method of illustrating a system, gaining common agreement and starting to analyze possible changes. Maps can be simple or complex, static or interactive, broad or focused. All are useful at different points.
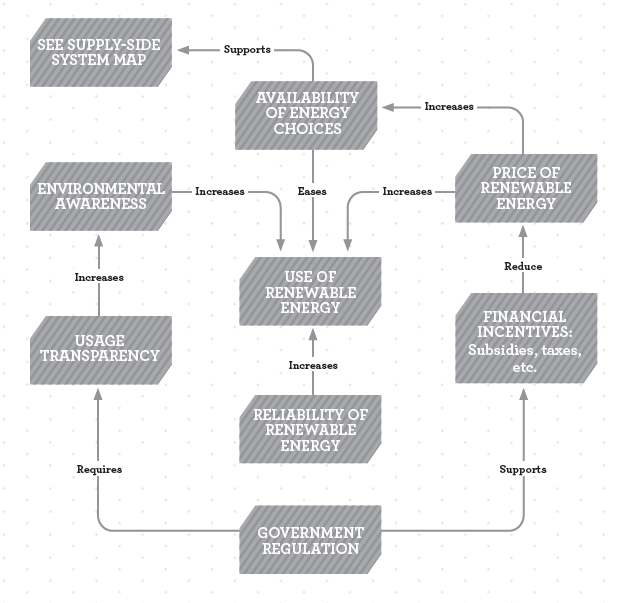
Figure 4: Demand Side Energy System Map; (williams et al. 2012)
In this simple example, we see a map of factors impacting demand for clean energy in Canada. One can “read” the map and identify relationships such as Government Regulation supports Financial Incentives. Those Financial Incentives reduce the Price of Renewable Energy that increases both the Availability of Energy Choices and the Use of Renewable Energy. Ideally, the map should use words to describe relationships. One must be able to “walk through” the map with the nouns and verbs mapped to variables and relationships. In a labs setting, participants can collaboratively build the system map and start to informally test by asking questions such as: Are there cases where Financial Incentives actually increase rather than reduce the Price of Renewable Energy? Are there factors that are missing from this map? Can we identify the quantitative relationships between these variables?
System maps can rapidly become extremely complex as shown by this map of the system impacting obesity in the UK, so it is necessary to use tools and techniques to isolate the relevant components.

Figure 5: Complex system map of obesity in the UK. (shiftn, 2006)
However, one can also achieve a marriage of simplicity and complexity. The map below, from Sendzimr et al., is actually mapping multiple regimes on the same map. The dominant “Protect landscape from the River” regime is mapped alongside the innovation regime “Live with the River” (Sendzimir et al., 2007)
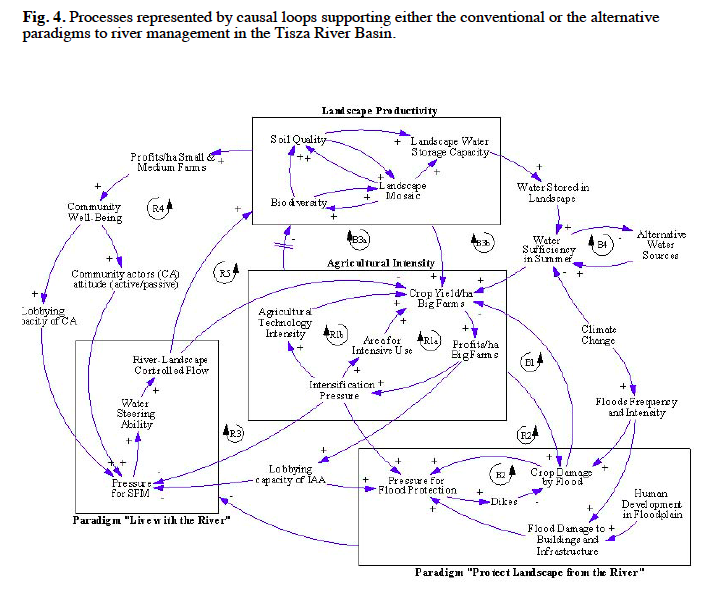
Figure 6: Dominant and Innovation Regimes as System Map. (Sendzimir et al., 2007)
From this map we can see that the dominant regime is deep and is connected to many strong institutions such as the agricultural lobby, water management bureaucrats and farmers. The innovation regime may have promise with some institutions but still needs deepening to make a viable alternative. We can use the map to test whether the system can move through influence or if it may still take a crisis to tip. And of course we must remember that unless the alternative is ready, the system may revert to the dominant regime. If integrated into a simulation tool, this type of system map could play a powerful role in helping participants understand how proposed actions or innovations might move the system in one direction versus another.
The figure below shows a simpler system. It illustrates how new tools are allowing increased interactivity with the system. This figure is showing the relationships of jobs in the traditional resource sector and how those might transition to the clean technology sector – often a promise of governments and environmental groups looking to a green jobs future. The map illustrates that the transition rate to new jobs is impacted by both availability of retraining funds and the availability of clean tech jobs. The model could be made more sophisticated by adding elements to model job readiness. We will return to an example with that level of complexity later. This model, created using an online tool called Insight Maker , allows Labs participants to change variables and run a simulation to see the impact over time on jobs, transition rates and, in this case, CO2 concentration levels. The tool allows for complex and nonlinear relationships to be modeled. Tools such as Insight Maker, Vensim and Stella provide a bridge from the first phase of decision making – gaining a common understanding of the system – to the second – exploring alternatives.
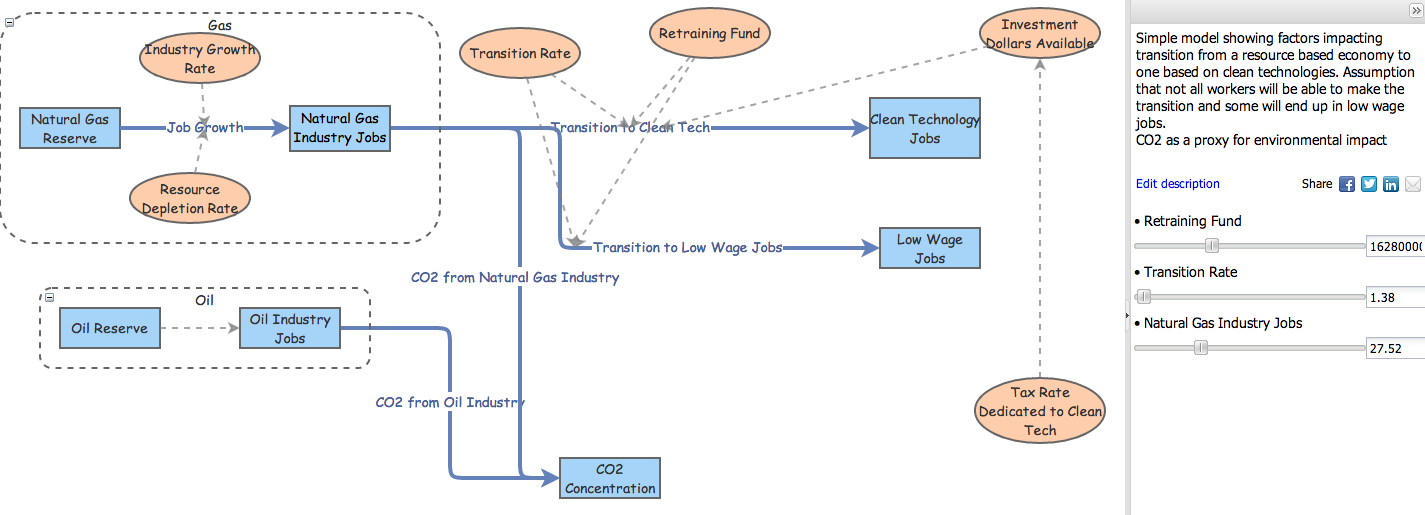
Figure 7: Clean Technology Job Transition Model using Insight Maker (Williams, 2012)
Linking Basins of Attraction with Complex Adaptive System Mapping
A key concept when looking at basins of attraction is that resilience is not a “good” per se. If we link the basins concept to Holling’s adaptive cycle (cited in Westley et al., 2006), we can ask questions such as: Are we looking at where an existing system is brittle, in rigidity trap? Are there factors that may be keeping a system in a deep basin or could there be an opportunity for change?
Just as important to consider when reducing the resilience of the old system how we are building the resilience of the innovative alternative. The example of Egypt and the Arab Spring provides a chilling example of what can happen if the alternative is not sufficiently resilient. After the energy of the Arab Spring and the removal of President Mubarak, there was much hope for a new regime – a new model of democracy in Egypt. When the new President, under the influence of the Army, proposed changes to the constitution that would provide him personal immunity from prosecution and enshrined military presence in the government, this seemed to dash the recent hopes. (Westley, Personal Communication, November 27, 2012) Through the lens of the Basins of Attraction theory, we can see that without a suitably resilient alternative, the system simply reverted back to its old state. Holling notes that systems can exhibit very strong qualities of rememberance and revert to earlier states as a matter of course. (cited in Westley et al., 2006)
New Tools
What is not yet available is a visualization tool that would integrate these models. One could imagine a three dimensional basins of attraction model that was dynamically linked to an interactive system map. As participants in a lab changed variables and modeled system interventions in the system map, the basins model would update, the levels rising and falling. At a certain point, the system would “tip” to a new regime. The visualization could even simulate the level of resilience in the alternative system. Visually, the system would either “drop” into the new resilient system or, through rememberance, “bounce” back into the old regime. For example, one could reference polling data, real time prediction markets, or pre-built analysis to identify algorithms that would determine how the basins rise or fall based on system interventions. Software (referenced above) exists to model these types of simulations within systems, what is required is software that would model the relationships between systems.
The model could reflect more complexity by recognizing that there are rarely only two alternatives. For example, looking at Canada’s health care system, many people would agree that we have serious challenges maintaining funding and service levels as the system is currently designed. Yet there is a deep and immediate reaction to proposed changes in large segments of the population. This may be an intuitive sense that as a regime starts to change, there is a risk that the system will fall, not into the desired alternative, but the “next adjacent” system (a system that is not perceived as desirable). In this example, the “next adjacent” system might be that of the United States. An interactive visual model of the system state changes linked to the basins of attraction model would provide a useful framework for addressing and discussing this concern in a Labs setting.
Next time, more on enabling deep interactions with systems and how to make decisions based on alternatives.
References
Gundry, Lisa K.; Kickul, Jill R.; Griffiths, Mark D.; and Bacq, Sophie C. (2011) “ENTREPRENEURIAL BRICOLAGE AND INNOVATION ECOLOGY: PRECURSORS TO SOCIAL INNOVATION?,” Frontiers of Entrepreneurship Research: Vol. 31: Iss. 19, Article 3.
Sendzimir, J., P. Magnuszewski, Z. Flachner, P. Balogh, G. Molnar, A. Sarvari, and Z. Nagy (2007). Assessing the resilience of a river management regime: informal learning in a shadow network in the Tisza River Basin. Ecology and Society 13(1): 11. [online] URL: http://www.ecologyandsociety.org/vol13/iss1/art11/
Shiftn. (2006). Obesity System Influence Diagram. Retrieved from http://www.shiftn.com/obesity/Full-Map.html
Smith, A. (2007). Translating Sustainabilities between Green Niches and Socio-Technical Regimes. Technology Analysis & Strategic Management, Vol. 19, No. 4, 427-450
Westley, F., M.Q. Patton, and B. Zimmerman. (2006) Getting to maybe: How the world is changed. Toronto: Random House Canada.
Walker, B., C. S. Holling, S. R. Carpenter, and A. Kinzig. (2004) Resilience, adaptability and transformability in social–ecological systems. Ecology and Society 9(2): 5. [online] URL: http://www.ecologyandsociety.org/vol9/iss2/art5
Westley, F., Per Olsson, C.F., Homer-Dixon,T.,Vredenburg, Loorbach D., John Thompson, J., Nilsson, M.,Lambin, E., Sendzimir, J., Banerjee, B., Galaz, V.& van der Leeuw, S. (2011) Tipping Toward Sustainability: Emerging Pathways of Transformation. Royal Swedish Academy of Sciences
